

In the modern digital world, keeping the server at its best performance is vital in business continuity and user satisfaction. The IT infrastructure of organisations in all industries is critical in providing smooth experiences, and therefore, loss of performance or downtime is unacceptable. It is here that server monitoring tools emerge as an essential resource to the IT team and system administrators.
Monitoring tools of servers have advanced beyond ping tools and are now advanced devices that give you an in-depth view of your whole infrastructure. Contemporary server monitoring software provides such functions as real-time alerting, automatic discovery, customizable dashboards and artificial intelligence-based predictive analytics. This is a full guide to the 11 best server monitoring tools in 2025, to identify the ideal infrastructure solution for your system.
What Are Server Monitoring Tools?
Server monitoring tools are dedicated software environments that are used to monitor in real-time the health, performance and availability of servers within an IT infrastructure. Such solutions gather and process metrics as CPU utilisation, memory usage, disk space, bandwidth, and response time of applications. These tools can help the IT teams to track bottlenecks, anomalies, and respond to incidents in time before they affect the end-users because they offer real-time visibility of what the servers are doing.
Also Read: Best Software License Management Tools
Essential Features to Look for in Server Monitoring Tools
To choose an appropriate server monitoring solution, one must pay attention to the features of a solution that a particular organisation needs based on the complexity of its infrastructure and operational needs. The most useful are the ones that offer easy-to-use features with robust capabilities that give actionable insights as opposed to bombarding data. During the consideration of alternatives, consider features that make it more visible, faster, and cover the workflow of your team.
- Real-Time Control and Notifications: The constant monitoring of server metrics and real-time alerts in case of threshold violation will help your team to react to the problems in a few minutes instead of hours.
- Automated Discovery and Inventory Management: It becomes unfeasible to configure the targets of monitoring manually as infrastructure grows, and automated discovery is a necessity to ensure the maintenance of the necessary visibility.
- Flexible Dashboards and Reporting: Visualisation enhances the use of uncoded data and implies the transformation of metrics into actionable insights by displaying them in easy-to-understand formats, depending on the stakeholders.
- Scalability and performance: As the size of your infrastructure increases, your monitoring solution should also scale with it without slowing it down or having to reconfigure it entirely.
- Integration Capabilities: Current IT environments are made of a variety of tools and platforms, which must work in harmony to ensure efficient operations.
Top 10 Server Monitoring Tools
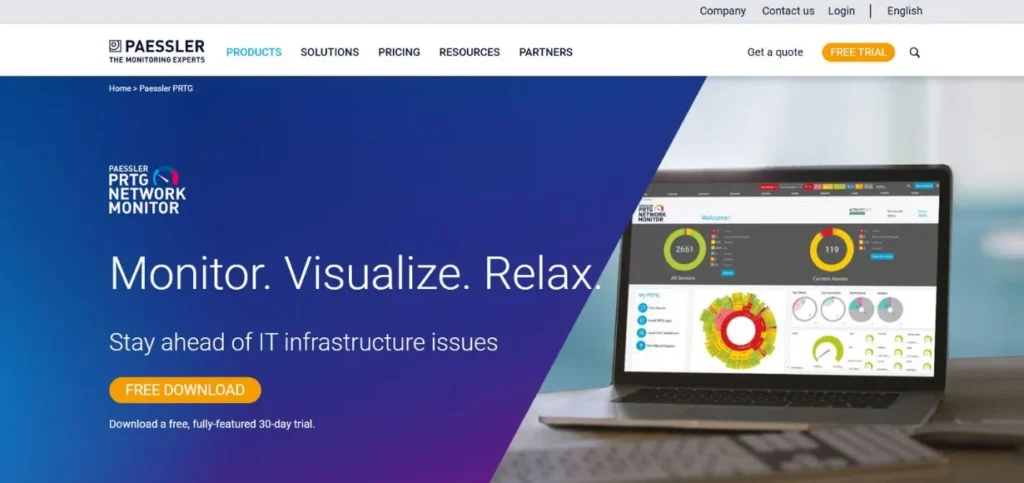
1. PRTG
Rating: 4.7/5
Website: https://www.paessler.com/prtg
Best Use Cases: Small to mid-sized networks requiring customizable monitoring dashboards
PRTG is a highly customizable monitoring system that is targeted towards companies that operate small to medium-sized networks. The tool offers full visibility of the mail servers, web servers, database servers, file servers, virtual servers and cloud infrastructure. The ability of teams to start monitoring with preconfigured sensor types over 250 in total that come in the package, making PRTG especially appealing, is the most attractive part of it. The platform provides real-time notifications in various forms, such as email and SMS, meaning that the IT team will be updated on any critical concerns, no matter the location.
Key Features:
- 250+ preconfigured sensors
- Real-time email alerts
- Customizable reporting capabilities
- Dynamic server adaptation
- Visual monitoring interface
Pros:
- Intuitive visual design
- Highly scalable solution
- Extensive customisation options
Cons:
- Learning curve exists
- Higher large-scale costs
- Complex advanced features
Pricing: From $2,149/year with a free trial available
2. Icinga
Rating: 5/5
Website: https://icinga.com/
Best Use Cases: Organisations seeking open-source flexibility for complex IT environments
Icinga is one of the best open-source monitoring tools that can be offered to organisations that handle complicated IT infrastructures. The platform comes with a rich connectivity monitoring feature that monitors basic protocols such as ping, SSH, TCP, UDP, and RDP in order to detect unreachable servers instantly.Icinga is automatically clustered, and the agents are connected via TLS to parent nodes or satellites via a single port that can be opened with a firewall.
Key Features:
- Extensive connectivity checks
- Multiple protocol support
- Time-series database flexibility
- Automatic clustering capability
- SSL certificate monitoring
Pros:
- Completely free solution
- Highly customizable platform
- Excellent scalability options
Cons:
- Steep learning curve
- Configuration complexity increases
- High-load performance issues
Pricing: Free to use with no setup fees
3. Checkmk
Rating: 4.7/5
Website: https://checkmk.com/
Best Use Cases: Large-scale infrastructure requiring real-time metrics and powerful visualisation
Checkmk offers monitoring features at the enterprise level with an explicit focus on IT administrators and the people who can manage large-scale infrastructures. The platform is advanced to manage various infrastructure aspects efficiently and guarantee the most effective performance and quick issue fixation. The most striking aspect about Checkmk is that it focuses on real-time metrics: the entire set of dashboards is updated in seconds, and one can see at a glance what is happening to the infrastructure.The comprehensive monitoring features of the tool apply to servers, applications, networks and cloud environments, which make it a really diverse tool when it comes to heterogeneous environments.
Key Features:
- Real-time dashboard updates
- Automated device discovery
- Customizable alert system
- REST API integration
- Powerful visualisation tools
Pros:
- Highly scalable architecture
- Dashboard customisation flexibility
- Third-party API integration
Cons:
- Complex initial setup
- Learning curve required
- Advanced configuration needed
Pricing: Pricing upon request, with a free trial available
4. Site24x7
Rating: 4.6/5
Website: https://www.site24x7.com/
Best Use Cases: Cloud-based, comprehensive server metric tracking for distributed teams
Site24x7 is a monitoring platform that is cloud-native and which is specifically designed to suit IT operations and DevOps teams dealing with distributed infrastructure. It is a tool that gives a full scope of monitoring of websites, servers, applications, and the network infrastructure to deliver optimal performance and availability. Through automated notification, prompt resolution will be achieved to any problem that may arise; this will reduce the mean time to solve and the possibility of prolonged outages.
Key Features:
- Cloud-based architecture
- Synthetic monitoring capabilities
- Real-time performance tracking
- Detailed analytics dashboards
- Automated alert system
Pros:
- Comprehensive monitoring coverage
- Real-time notifications
- Customizable dashboard views
Cons:
- Complex initial configuration
- Limited alerting customisation
- Large environment setup
Pricing: Pricing upon request, with a free trial and demo available
5. Auvik
Rating: 4.7/5
Website: https://www.auvik.com/
Best Use Cases: Agentless Windows server monitoring for network teams and MSPs
Auvik is a platform for cloud network and server monitoring that is specifically designed to suit network teams and managed service providers. The product has a unique feature of being agentless in monitoring Windows servers and network devices, which does not require software to be installed on the systems being monitored. In addition to real-time monitoring, Auvik can offer useful trending information that can support capacity planning programs to enable organisations to make sound decisions regarding investments in infrastructure.
Key Features:
- Agentless monitoring approach
- Automatic device discovery
- Real-time threshold alerting
- Trend analysis data
- Network topology visualisation
Pros:
- Prompt alerting system
- Configuration backup capabilities
- Immediate performance insights
Cons:
- Limited non-Windows support
- Complex advanced setup
- Windows-focused platform
Pricing: Pricing upon request, with a free demo available
Also Read: Best Proxy Servers
6. ManageEngine OpManager
Rating: 4.3/5
Website: https://www.manageengine.com/network-monitoring/
Best Use Cases: Continuous server tracking with comprehensive network device monitoring
ManageEngine OpManager provides real-time monitoring services for organisations that need to always be aware of the performance of their servers, their uptime, and their health. The platform keeps the servers going with continuous polling over various protocols such as ICMP, SNMP, WMI, and TCP. The real-time monitoring technique allows quick response to the I/O requests and ensures that the end-users are connected seamlessly. The network mapping functions of OpManager deliver useful tools to see the data flow between servers and stacks of the infrastructure seamlessly, and point out the bottlenecks where requests stall. The system monitors metrics like loss of packets and response time to detect and resolve the latency problems that are induced by servers.
Key Features:
- Multi-protocol polling support
- Network mapping visualisation
- Packet loss tracking
- Response time monitoring
- Automated workflow capabilities
Pros:
- Comprehensive monitoring features
- Real-time alerting system
- Network scalability support
Cons:
- Complex initial setup
- Occasional update issues
- Configuration learning curve
Pricing: Pricing upon request with a 30-day free trial
7. LogicMonitor
Rating: 4.5/5
Website: https://www.logicmonitor.com/
Best Use Cases: Hybrid infrastructure monitoring covering on-premises and cloud resources
LogicMonitor focuses on the hybrid IT environment, where companies use both on-premise and cloud environments. The cloud-based platform offers profound application, network and server insights, which allows the effective management of performance irrespective of the location of resources.Predictive alerting mechanisms assist in aiding the teams to predict and respond to possible problems before they can have any effect on the operations or end-users.
Key Features:
- Automated discovery process
- Hybrid environment support
- Customizable dashboard views
- Predictive alert system
- Unified infrastructure visibility
Pros:
- Comprehensive hybrid coverage
- Automated device discovery
- Intuitive user interface
Cons:
- Complex initial setup
- Advanced feature training
- Configuration complexity increases
Pricing: From $3/resource/month with free trial available
8. Dynatrace
Rating: 4.5/5
Website: https://www.dynatrace.com/
Best Use Cases: AI-powered application performance monitoring for enterprise environments
Dynatrace is an artificial intelligence-powered platform that enables enterprise IT organisations and DevOps practitioners to have complete insight into apps and infrastructure. The full-stack approach to monitoring gives visibility of applications, infrastructure, and user experience in one place, which removes blind spots where a problem can be emerging. The real-time analysis of data enables teams to make informed decisions quickly with reference to the current state of affairs and not the past averages.
Key Features:
- AI-driven root analysis
- Precise anomaly detection
- Full-stack monitoring coverage
- Real-time data analysis
- Comprehensive user tracking
Pros:
- Deep AI insights
- Comprehensive application monitoring
- Wide integration array
Cons:
- Requires dedicated training
- Setup complexity exists
- Steep learning curve
Pricing: From $0.0001 with a 15-day free trial and demo available
9. New Relic
Rating: 4.3/5
Website: https://newrelic.com/
Best Use Cases: Real-time application analytics with full-stack observability capabilities
New Relic offers full-stack observability that is specifically targeted at the DevOps team and IT operations tasked with the management of complex application environments. The system offers a full scope of monitoring of applications, infrastructure, and user experience, which guarantees ideal scaling. The real-time monitoring features can assist teams to be ahead of performance problems before they become a problem for user experience.
Key Features:
- Full-stack observability
- Deployment marker tracking
- Customizable dashboard views
- Real-time monitoring system
- Detailed alerting mechanism
Pros:
- In-depth application monitoring
- Real-time analytics capability
- Broad cloud support
Cons:
- Overwhelming for newcomers
- Custom instrumentation effort
- Learning curve exists
Pricing: Pricing upon request, with a free plan and demo available
10. Nagios
Rating: 4.6/5
Website: https://www.nagios.org/
Best Use Cases: Comprehensive IT infrastructure monitoring with open-source flexibility
Nagios has been the most reliable open-source solution for monitoring of IT professionals and system administrators across the globe. The platform offers end-to-end monitoring of the infrastructure parts, to ensure that the systems, applications and services are running well in diverse conditions. Nagios provides open-source scalability, which enables teams to modify the tool to exactly meet their needs without being locked into the vendor. The massive library of plugins supports the monitoring of virtually any technology, protocol, or application using both free and paid extensions that have been developed by the community.
Key Features:
- Open-source platform
- Extensive plugin library
- Robust alerting system
- Scalable architecture
- Customizable dashboards
Pros:
- Wide-ranging monitoring capabilities
- Customizable dashboard options
- Strong third-party integrations
Cons:
- Dated interface appearance
- Annual licensing model
- Configuration complexity increases
Pricing: From $20/user/month (billed annually) with a 30-day free trial
How to Choose the Right Server Monitoring Tools
In selecting the appropriate server monitoring tools to apply in your company, one should take into consideration the different factors that are applicable, given your level of complexity of your infrastructure, the level of professionalism of your team and business objectives. The right choice is not only concerned with the needs of the now, but also with the future progress and the transformations of the monitoring demands. These are the most important requirements that should be put into consideration when making a decision.
- Infrastructure Scope and Complexity: Have an idea of the size and the variety of your infrastructure, how many servers you have, what types of operating systems you have, what types of virtualisation systems you have, which cloud providers and what network devices you have to be monitored.
- Budget, and Total Cost of Ownership: The two should be analysed in terms of initial cost as well as the total cost of ownership of the implementation in the short-run and long-run costs
- Ease of Use/Learning Curve: This is where the team’s level of technical ability and time available to learn the tool have to be looked at when comparing the server monitoring tools, which are of various complexities.
- Integration and Automation Capabilities: To which other technology stacks (e.g., ticketing systems, collaboration systems, configuration management tools
- Scalability and Future-Proofing: Choose server monitoring tools that go with your architecture without requiring a replacement when your growing workload or the arrival of a new technology.
Also Read: Top Password Recovery Tools
Conclusion
Powerful server monitoring systems are no longer an option among organisations that are now keen on ensuring proper IT infrastructure and provision of consistent user experiences. The eleven solutions that are taken into account in this guide are the best solutions of the year 2025, and each of the solutions has its own strengths depending on the different organisational needs and infrastructure peculiarities. The market is full of solutions to any need and any budget, and the most open-source solutions, like Icinga and Nagio, are as flexible as possible, and the most advanced solutions, like Dynatrace, are able to find anomalies using AI.
Frequently Asked Questions
Q: What Purpose Do Server monitoring Tools serve?
A: Monitoring tools that are provided by servers monitor the server health, performance, and availability of a server in real time by gathering metrics such as CPU utilisation, memory utilisation, disk input/output, and network traffic.
Q: Are open-source server monitoring solutions as effective as commercial solutions?
A: Granted, open-source server-monitoring software, such as Icinga and Nagios, provides strong functionality on par with commercial systems, and the benefit of the ability to fully customise and no licensing fee.
Q: What is the maximum number of servers that server monitoring tools can support?
A: The scalability of different server monitoring tools also differs greatly, with some tools being utilised in small implementations of dozens of servers and enterprise platforms managing tens of thousands of endpoints.
Q: Does the performance of systems being monitored get affected by server monitoring tools?
A: The majority of modern server monitoring tools are configured to have a limited effect on the performance of the monitored systems by using efficient data collection mechanisms and customizable polling periods. The agentless solutions, such as Auvi, do not add any software overhead to the servers under monitoring, whereas agent-based tools are usually resource-intensive.
Q: Are server monitoring solutions compatible with cloud solutions?
A: Yes, modern server monitoring systems offer the wide-ranging support of major cloud systems such as AWS, Azure, and Google Cloud. Cloud and hybrid AWS solutions such as Site24x7, Dynatrace, and New Relic are developed to support cloud resources and gather platform-specific metrics, automatically exploring the environment.